
Import an AMP Press ABP or CSV session.
PRECISION AMMUNITION DEVELOPMENT
Measure your process.
Measure your process.
Improve your ammunition.
Turn AMP Press seating-force data into optimized record groups, documented target results, and long-term insight into the loading choices that produce your most consistent ammunition.
Complete-curve analysisTarget photos, scores, and group sizesLoad-profile trend discovery
ONE CONNECTED WORKFLOW
From press data to what happened on paper.
Compare complete curves and identify unusual rounds.
Create the most internally consistent record targets.
Attach target images, scores, and measured group sizes.
Learn which load-profile values perform best over time.
FULL-BATCH ANALYSIS
See every trace—and the rounds that matter most.
Review the full loading session on one interactive graph. Highlight record groups, isolate likely outliers, inspect individual rounds, and keep the entire batch visible for context.
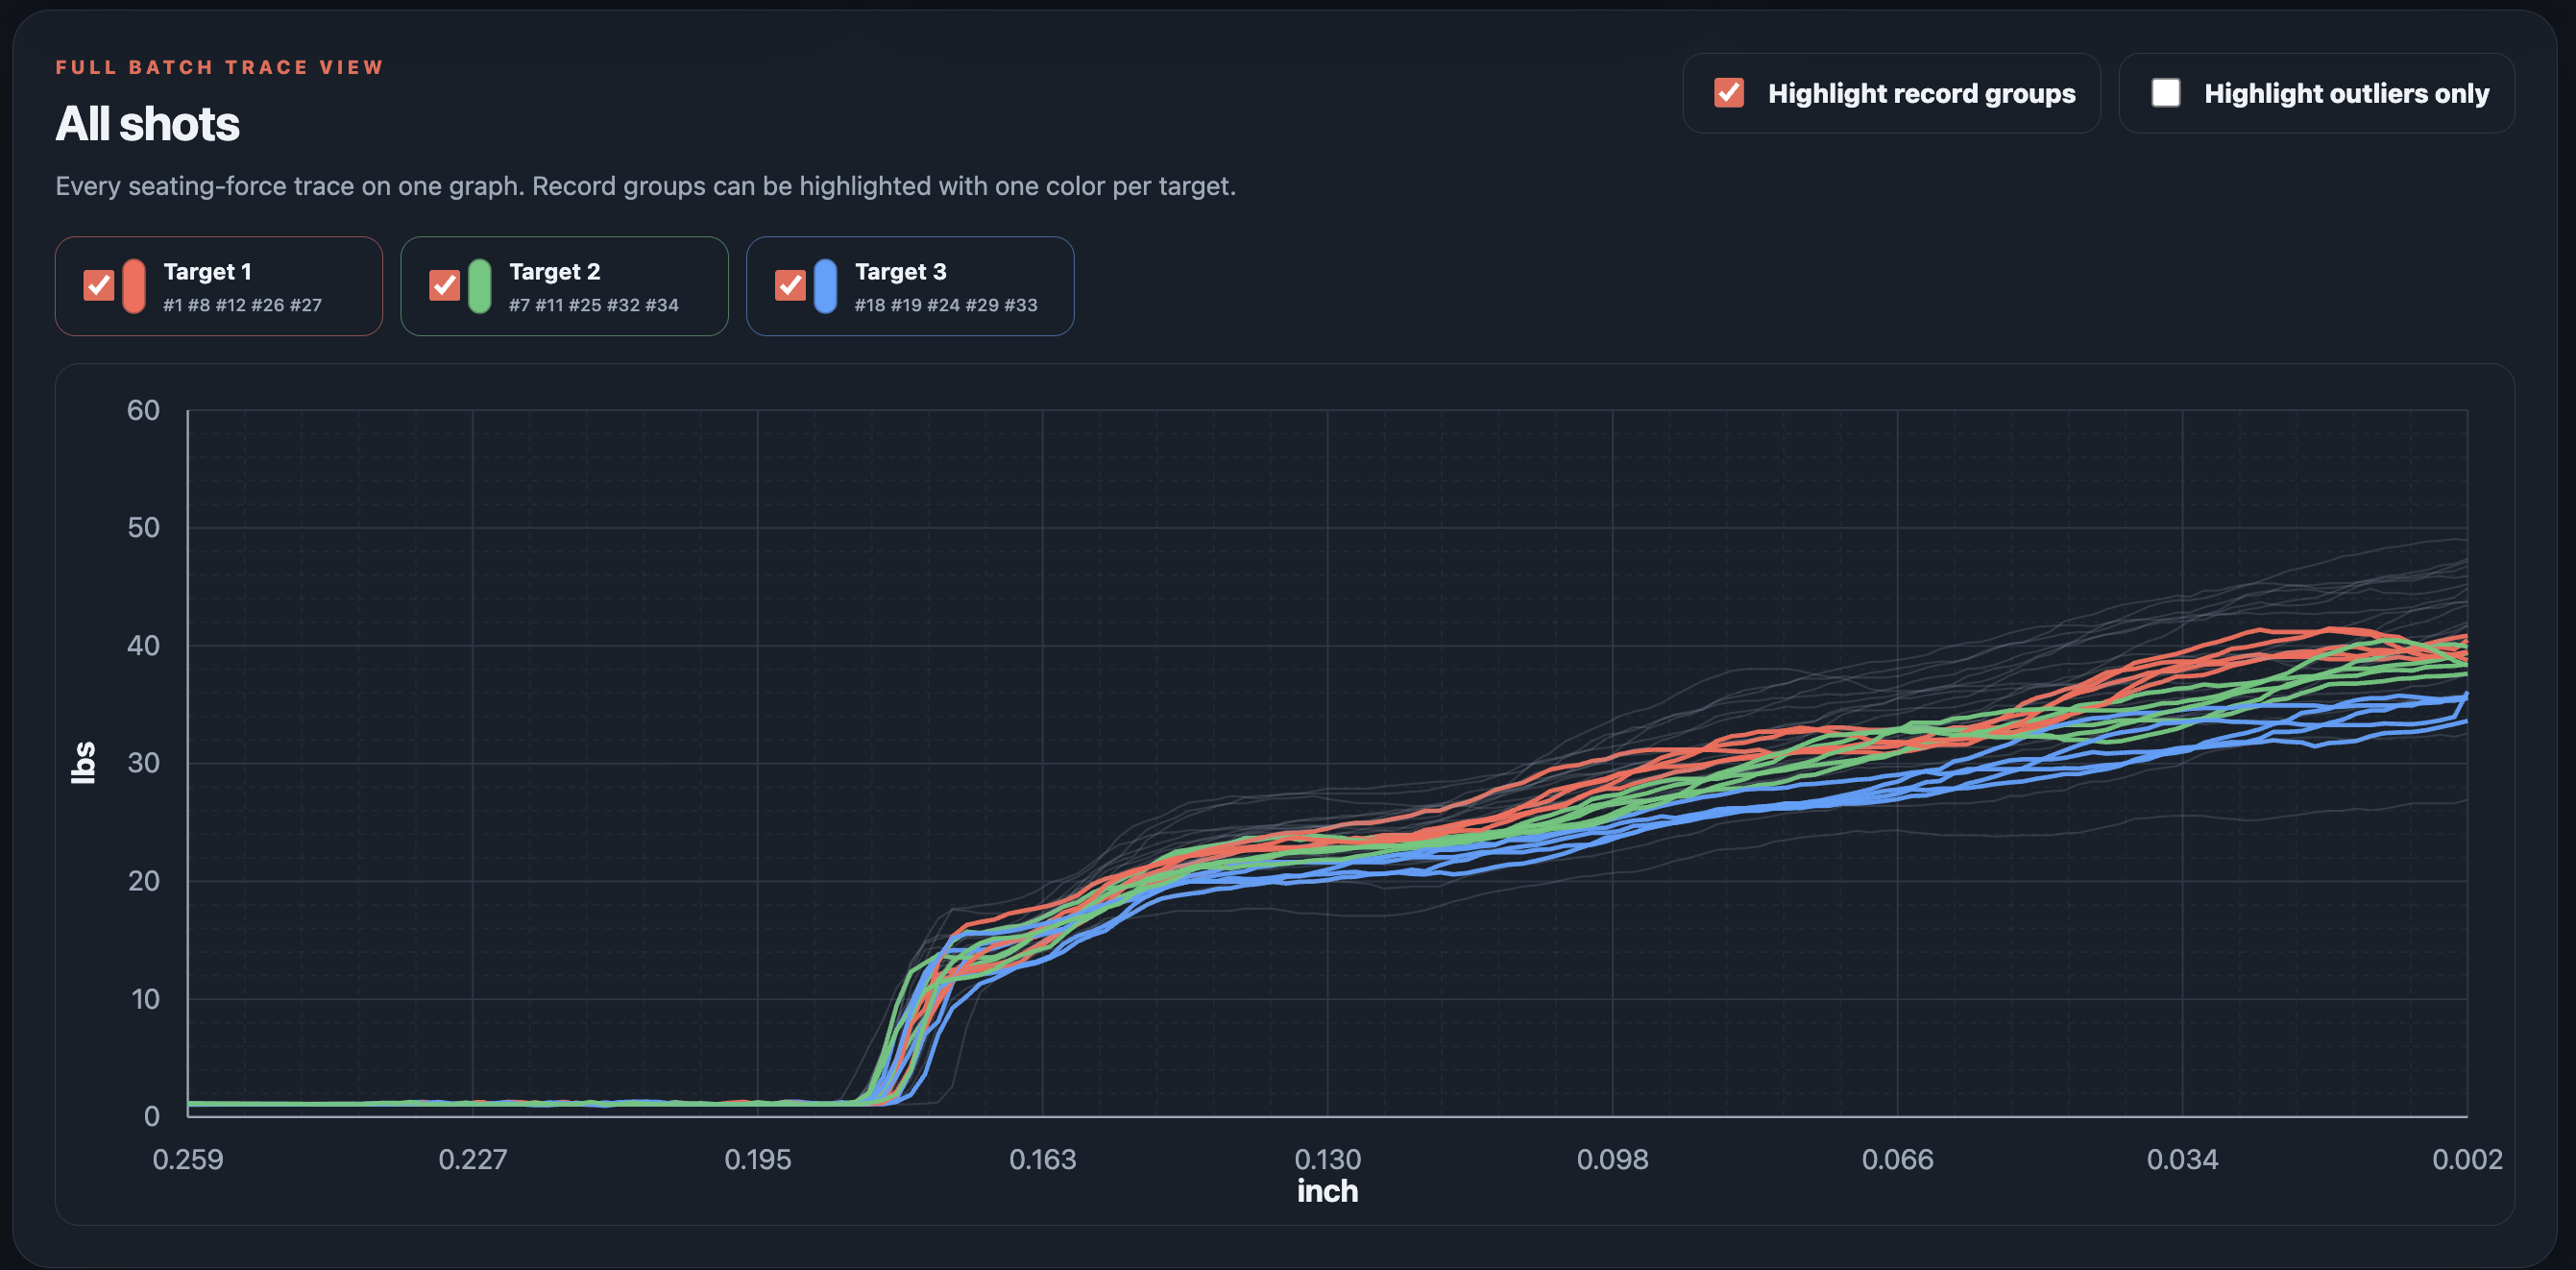
Similarity is based on the shape of the full seating stroke—not a single peak-force number.
Build record targets whose rounds match one another as closely as possible.
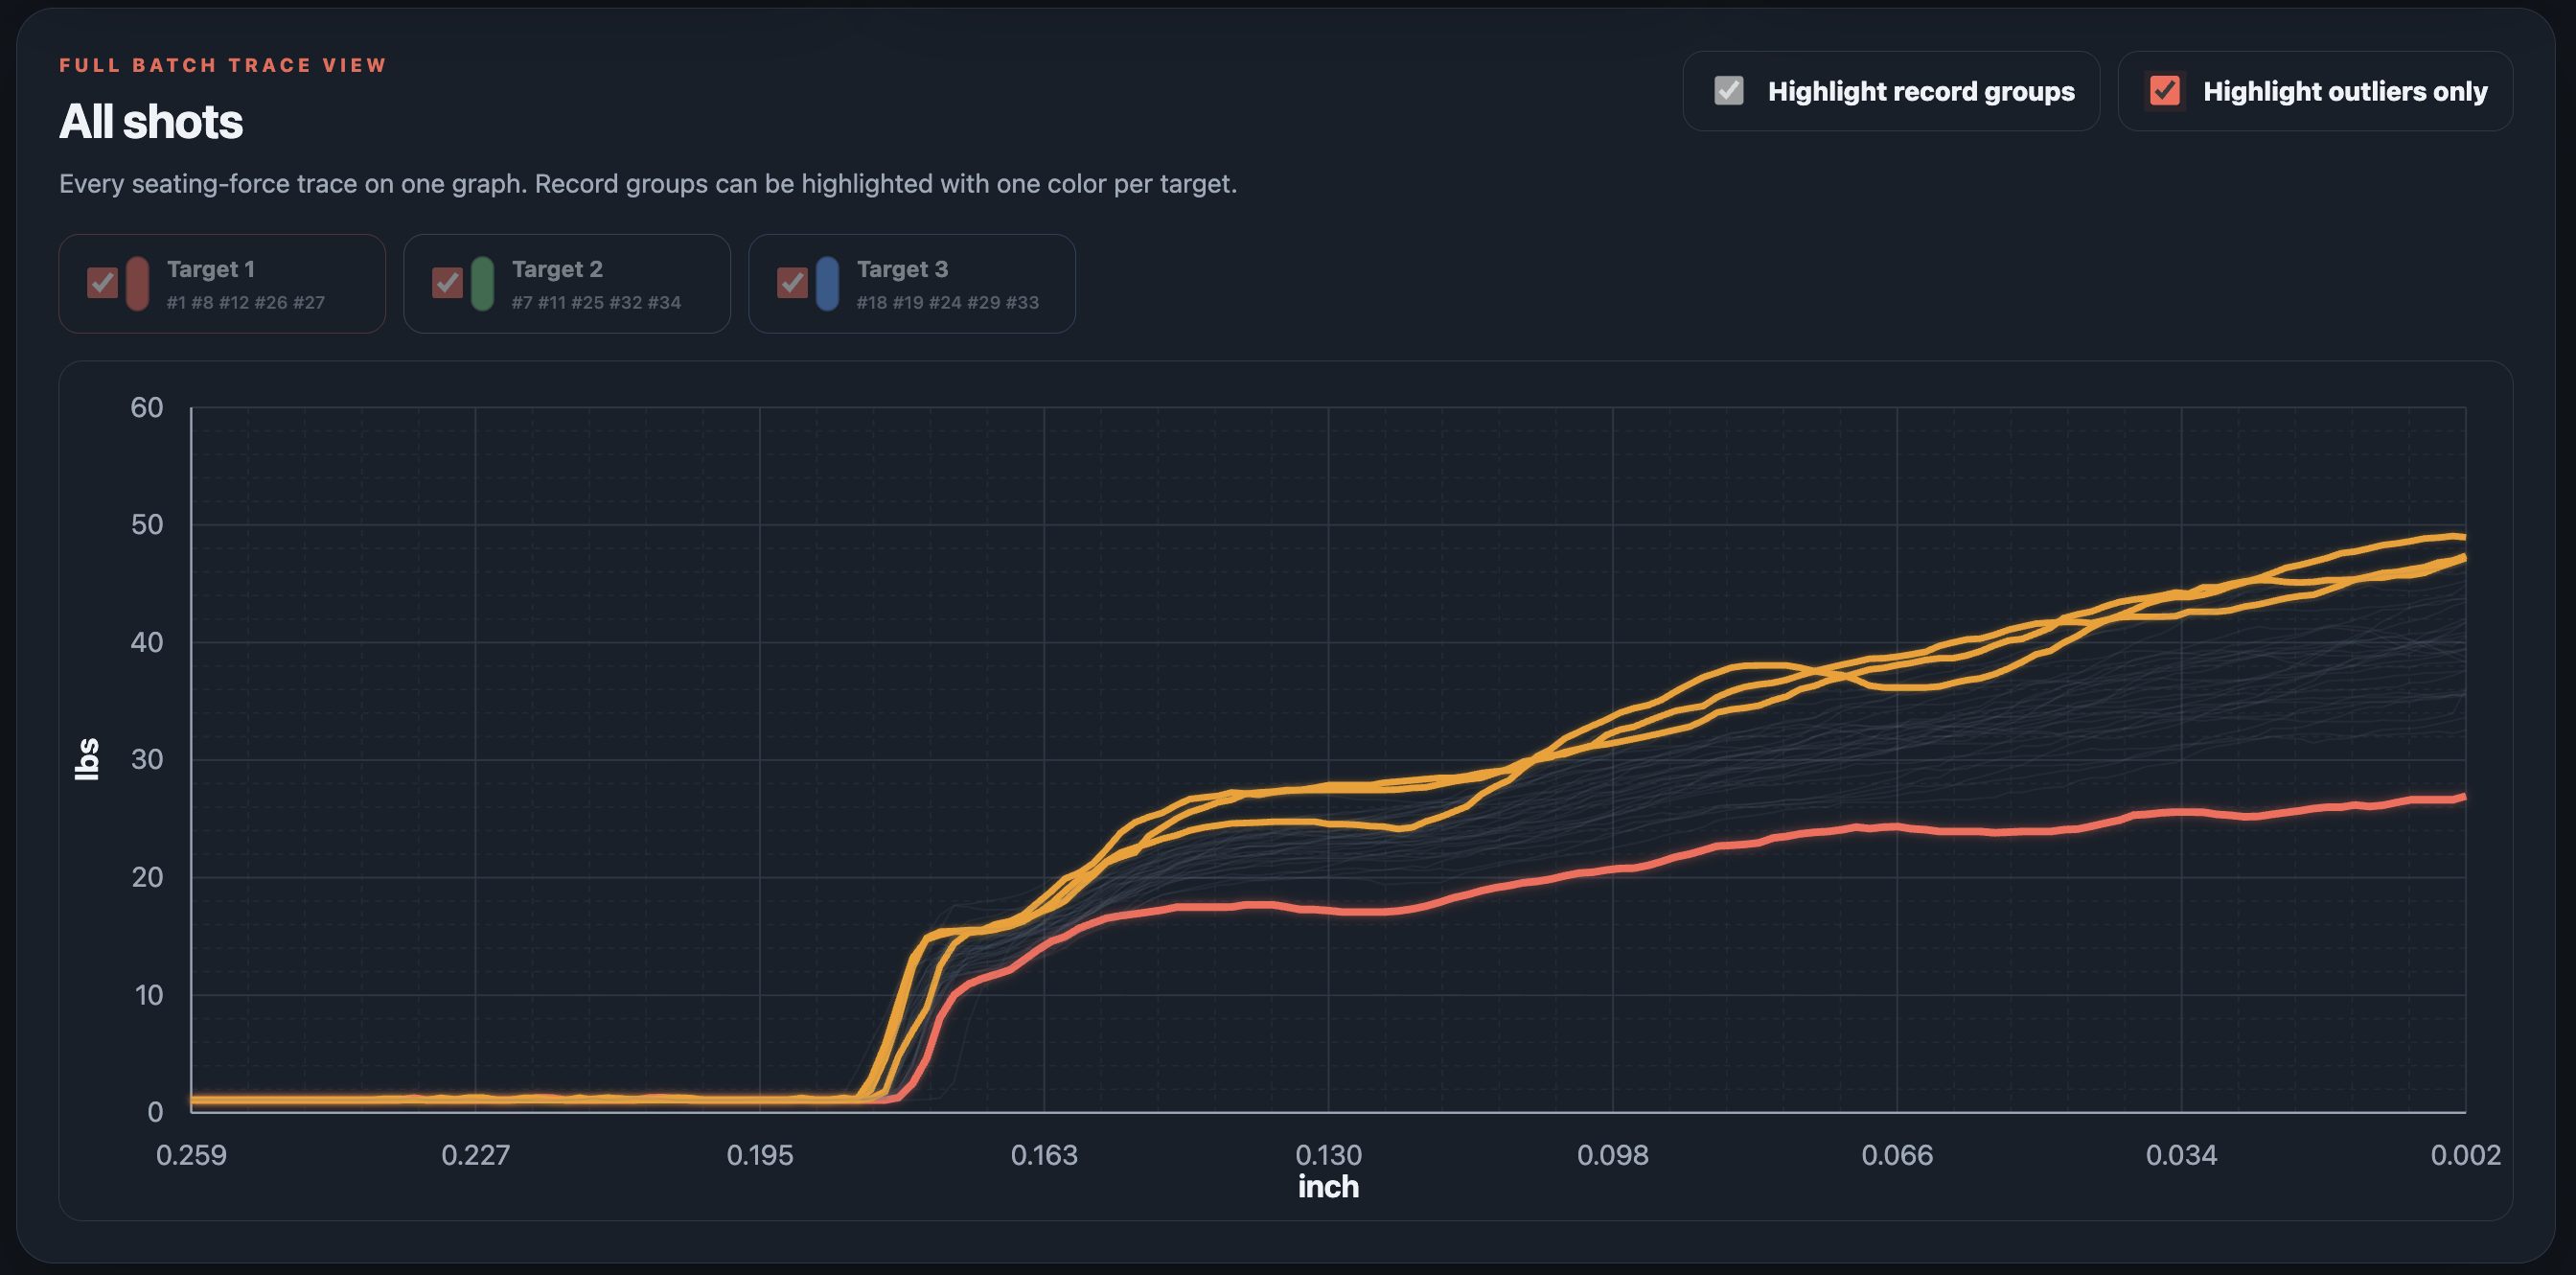
Separate likely outliers, review recommendations, and minor deviations without automatically discarding data.
Highlight record groups, outliers, sighters, or an individual round directly on the graph.
OUTLIER REVIEW
Find unusual rounds without losing the batch context.
The detector distinguishes likely outliers from moderate and minor deviations. Highlight only the rounds recommended for review while all other traces remain dimmed behind them.
- Practical absolute and statistical deviation checks
- Strong, moderate, and minor severity levels
- Outlier-highlighted graph included in reports
DOWNRANGE RESULTS
Connect each record group to its actual target.
After shooting, attach the target result to the exact analyzed group. Preserve the target image alongside the press data so the loading process and downrange outcome remain part of one record.
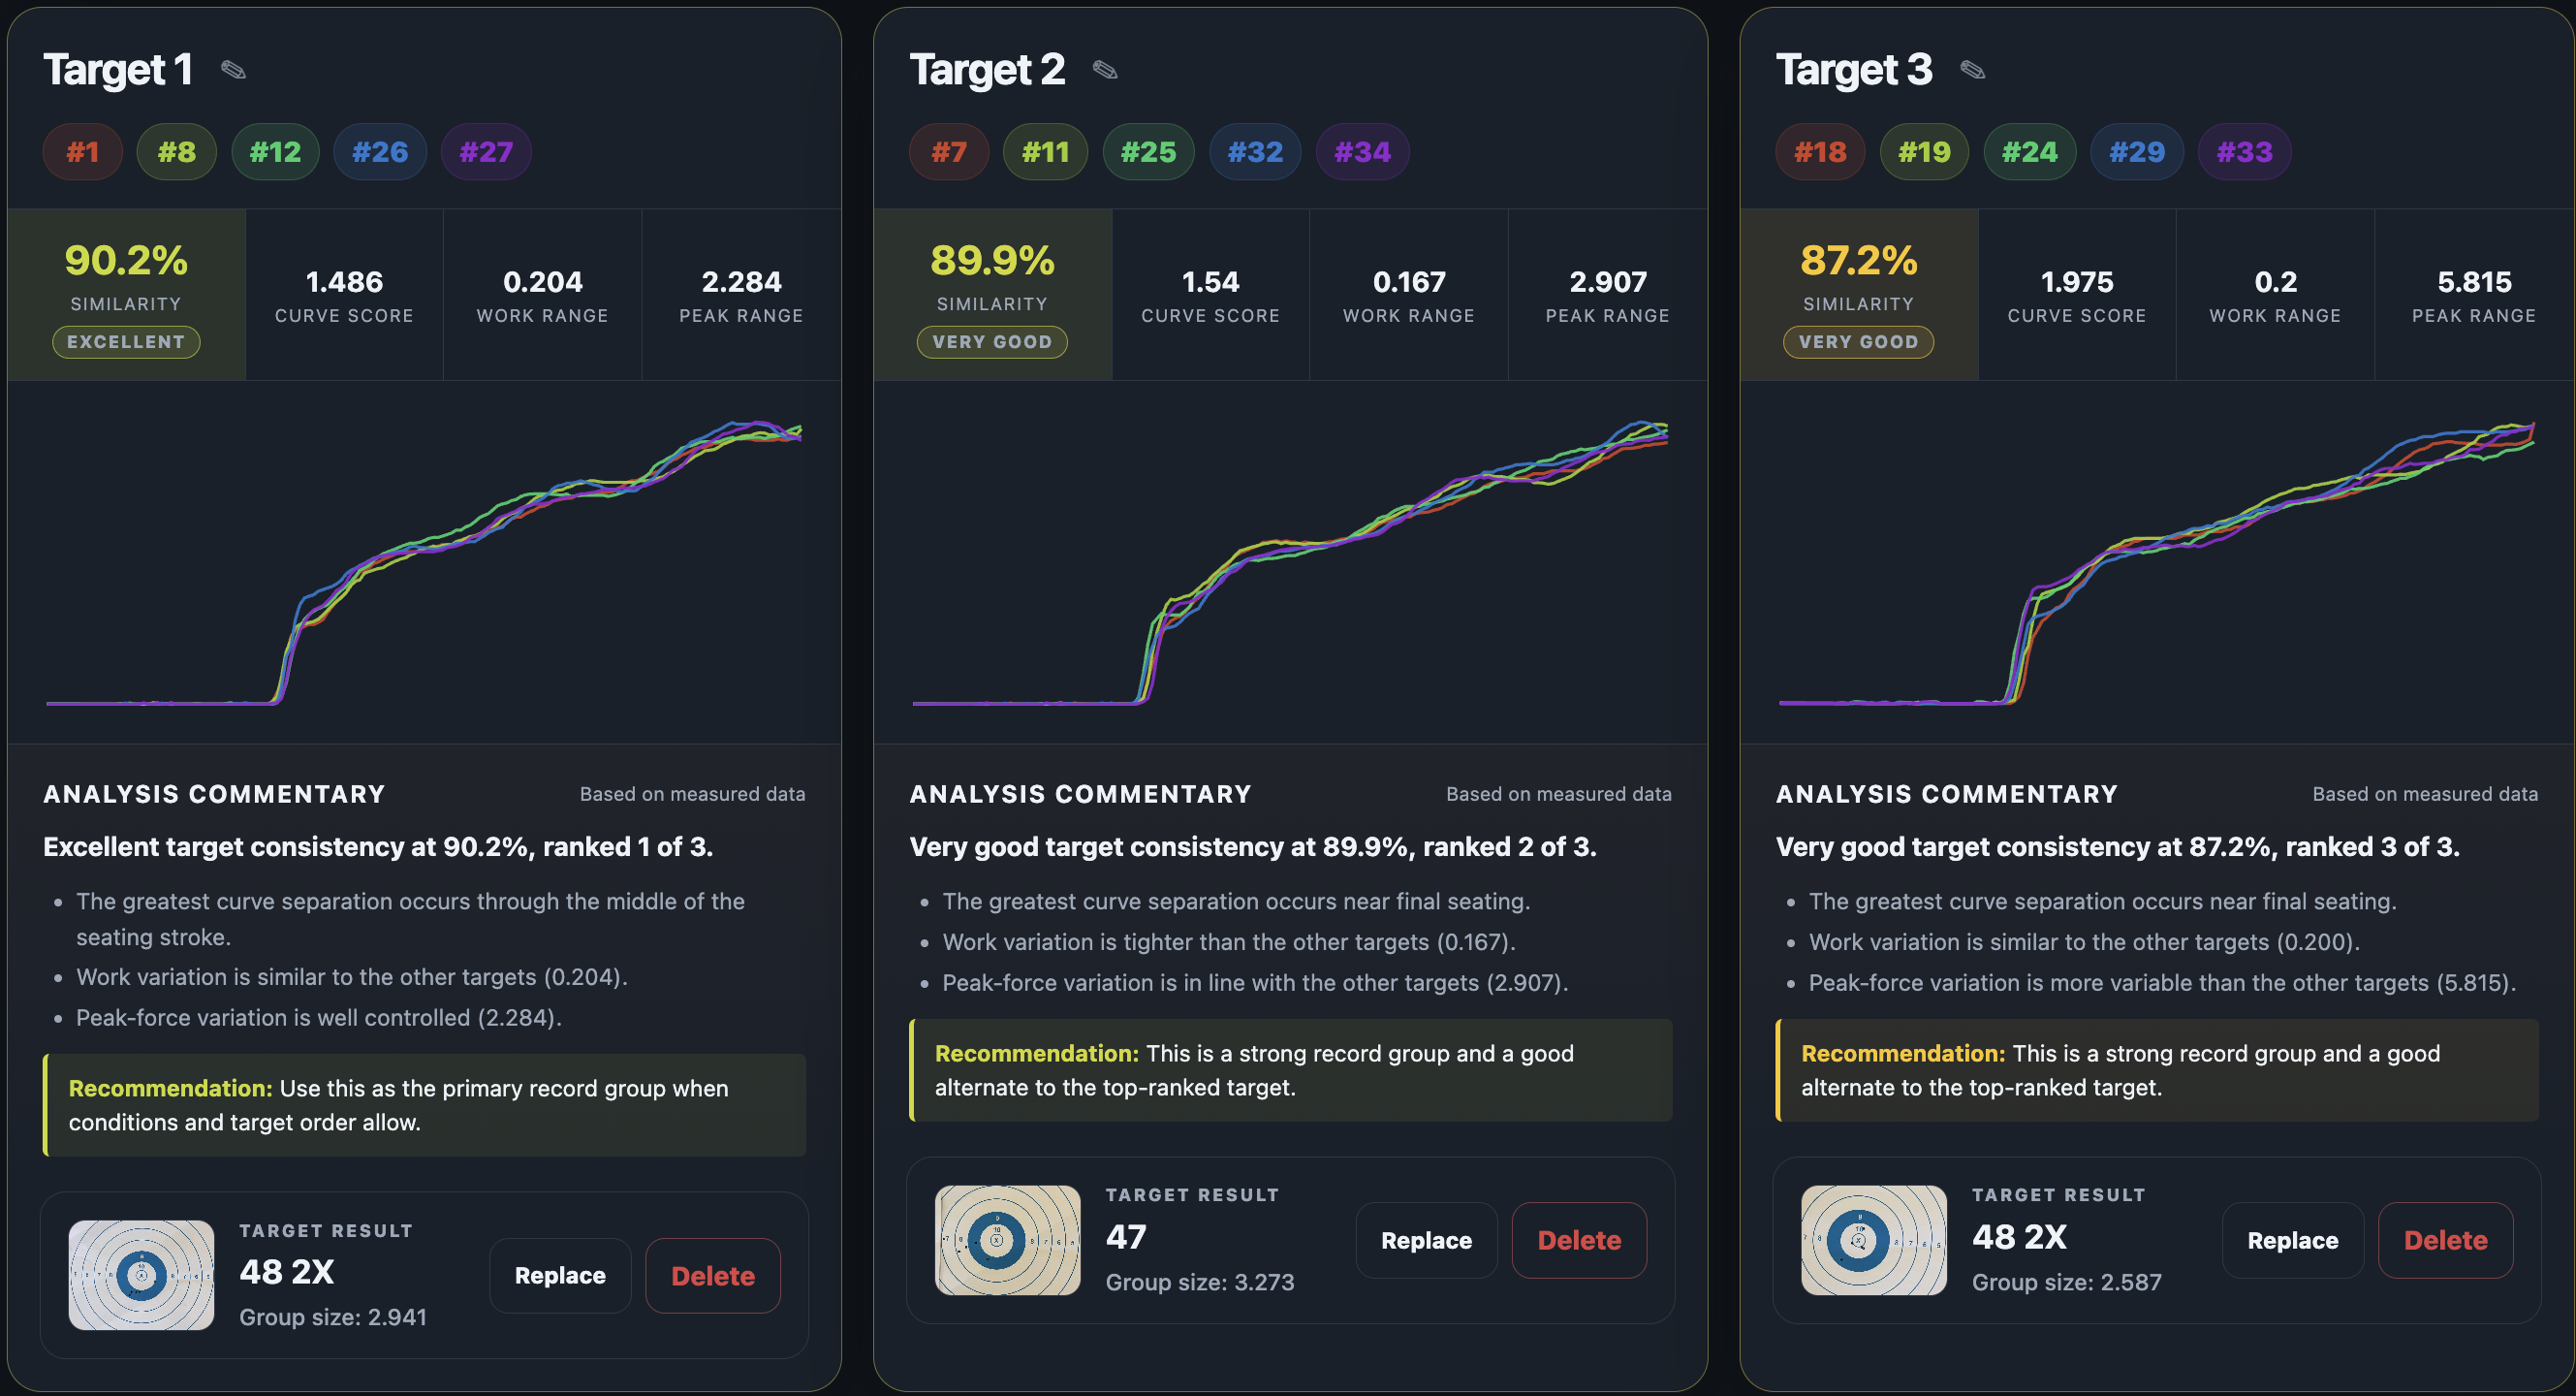
Upload a full-resolution photo, crop it in the browser, or preserve the complete image.
Record match-style scores such as 48-2X or any format appropriate to the target.
Save the measured group size with the target and its seating-force metrics.
Open a high-resolution viewer with zoom, pan, navigation, and the result data kept below the image.
LONG-TERM LOAD DEVELOPMENT
Discover which loading choices repeatedly produce better results.
Saved sessions become a history of your loading process. Compare selected sessions, follow consistency over time, and let Precision Load Analyzer identify associations between performance and the values stored in your Load Profiles.
See record-group, entire-batch, and no-outlier consistency across every saved session.
Select only the sessions you want and compare their metrics and chosen Load Profile fields side by side.
Surface repeated values—such as neck bushing, mandrel, annealing, or neck prep—associated with higher similarity.
REUSABLE LOAD PROFILES
Preserve the details behind every session.
Store rifle and component details once, reuse them during analysis, and choose exactly which fields appear when comparing saved sessions.
RifleCaliberBarrelBullet & lotPowder & lotChargePrimer & lotBrass & lotNeck bushingMandrelNeck prepAnnealedAztec settingPrimer depth
BUILT AS AN ANALYSIS AID
Measured data, transparent recommendations.
The Similarity Index reflects how closely complete seating-force curves within a group match one another. A perfect numeric match produces 100%, while meaningful curve differences reduce the score.
Outlier detection is a review aid, not a command to discard ammunition. Original traces remain visible and recommendations are separated by severity.
Trend findings are associations across saved sessions—not proof that one component caused the result. They are designed to guide controlled follow-up testing.
Precision Load Analyzer is an independent software product. AMP Press is a trademark of Annealing Made Perfect; this software is not affiliated with or endorsed by Annealing Made Perfect.
PRIVATE BETA
Build a clearer picture of your loading process.
Precision Load Analyzer is currently offered to a limited group of precision shooters and reloaders while the platform is refined. Tell us a little about yourself and we’ll follow up by email.
No pricing or payment is required to submit an interest request.